Roll every project up into live dashboards and reports, so the whole team — and your stakeholders — can see progress at a glance, and dig in when they need to.
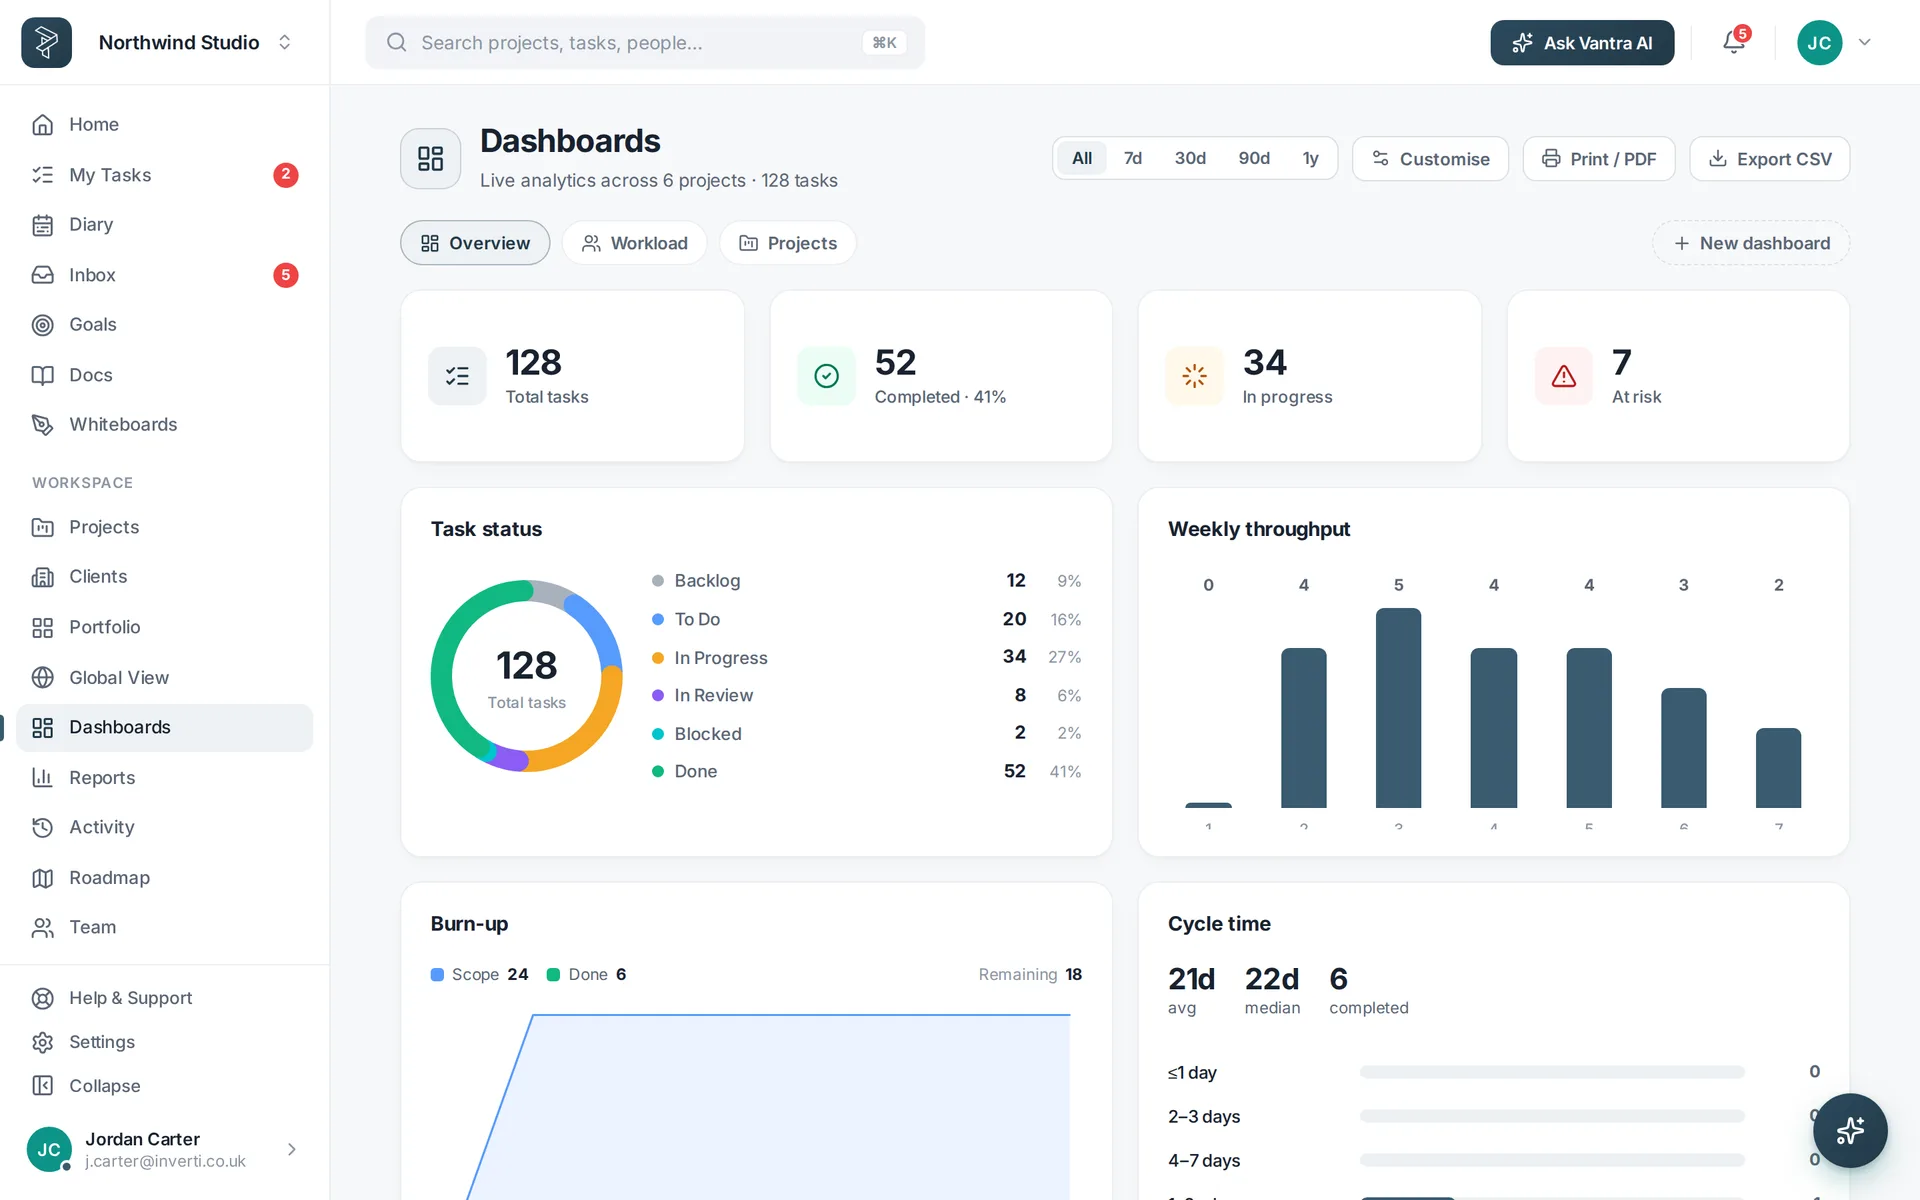
Drag-and-drop widgets onto a dashboard, set a date range, and make it your home. Three dashboards ship built-in; add as many as you like.
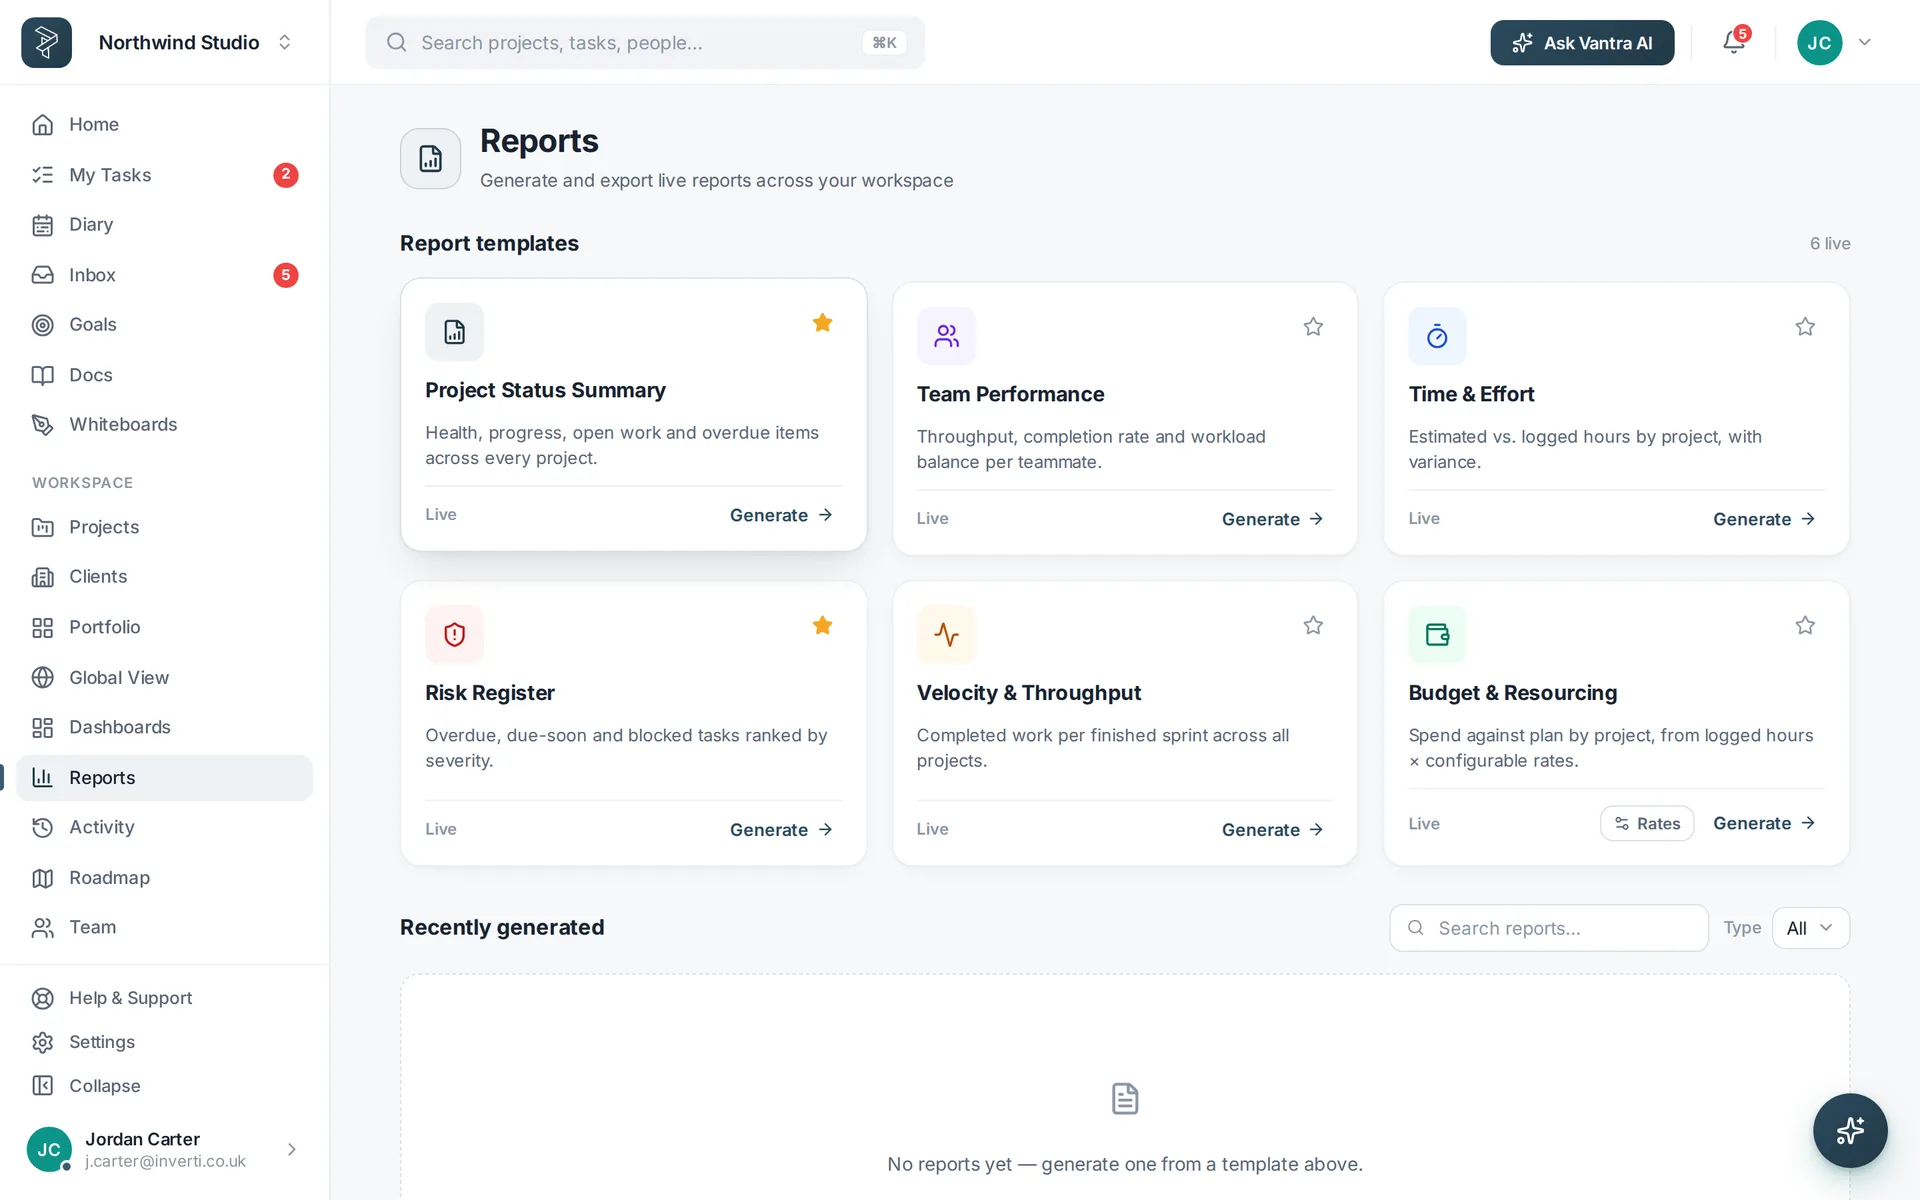
Six live report templates, each with KPIs, a table and a chart — generate, drill in, and export to PDF.
Configurable rates and members where it matters — no spreadsheet exports required.
Health, progress, open work and overdue items across every project.
Throughput, completion rate and workload balance per teammate.
Estimated vs logged hours by project, with variance.
Overdue, due-soon and blocked tasks ranked by severity.
Completed work per finished sprint across all projects.
Spend against plan by project, from logged hours × configurable rates.
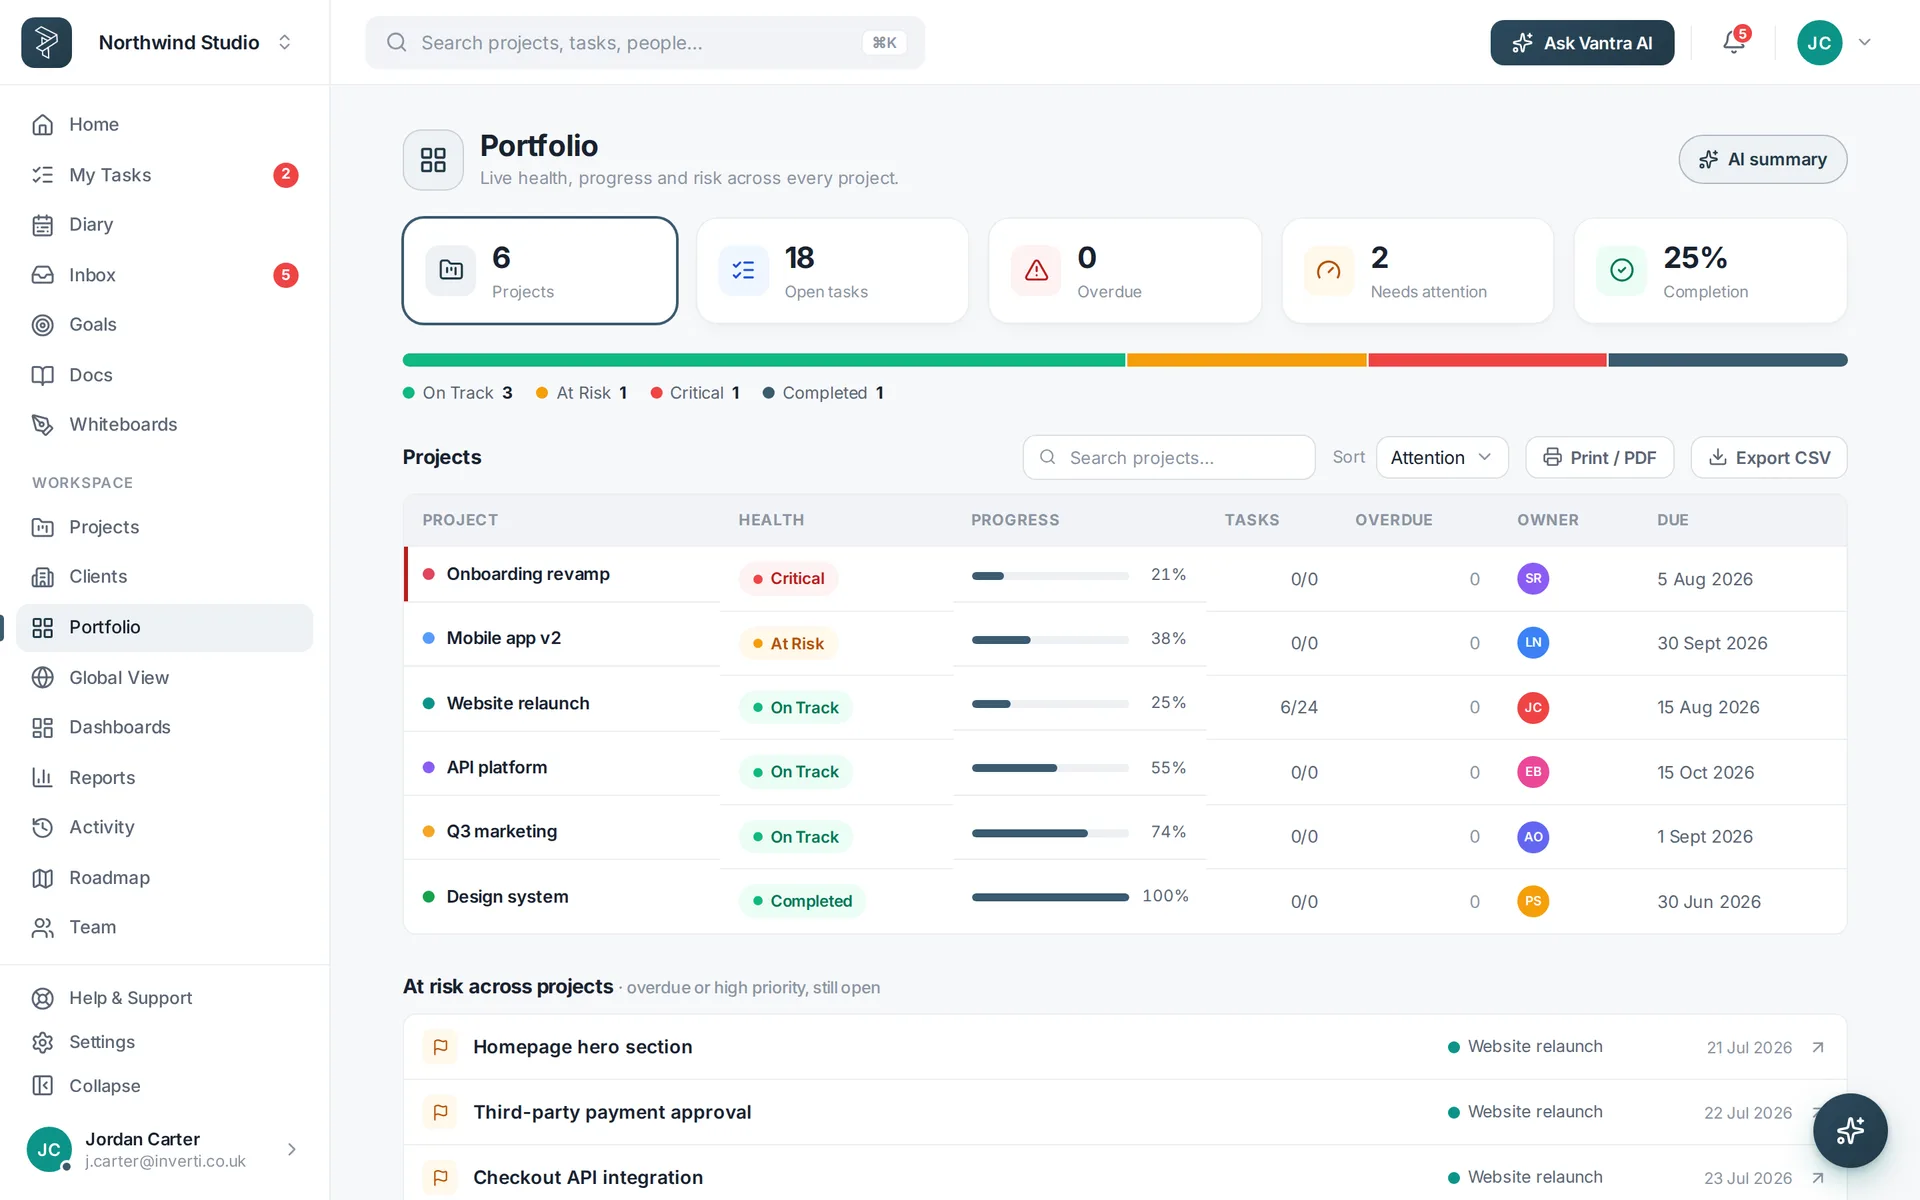
See every project's health in one place — what's on track, what's at risk, and what needs you today — with an AI summary on top.
Tasks, time and progress are captured automatically as your team works.
Drag the widgets that answer your weekly questions onto a board and set a range.
Generate a live report, drill into any number, and export to PDF for stakeholders.
Yes. Drag and resize any of 28 widget types onto a dashboard, set a date range, and make it your home. Three dashboards ship built-in.
Yes. All six report templates reflect the current state of your projects, and you can drill from any number into the underlying tasks.
Yes — export dashboards and reports to PDF, or print them.
From logged hours × configurable member or project rates, so the Budget & Resourcing report shows real spend against plan.
Live dashboards, six reports and portfolio health — so nothing slips and everyone knows where things stand.