1Start with the questions
A good dashboard answers the questions you're already being asked: Are we on track? Who's overloaded? What slipped? What shipped? Write those down first and add a widget per question — not the other way round.
2Add the widgets
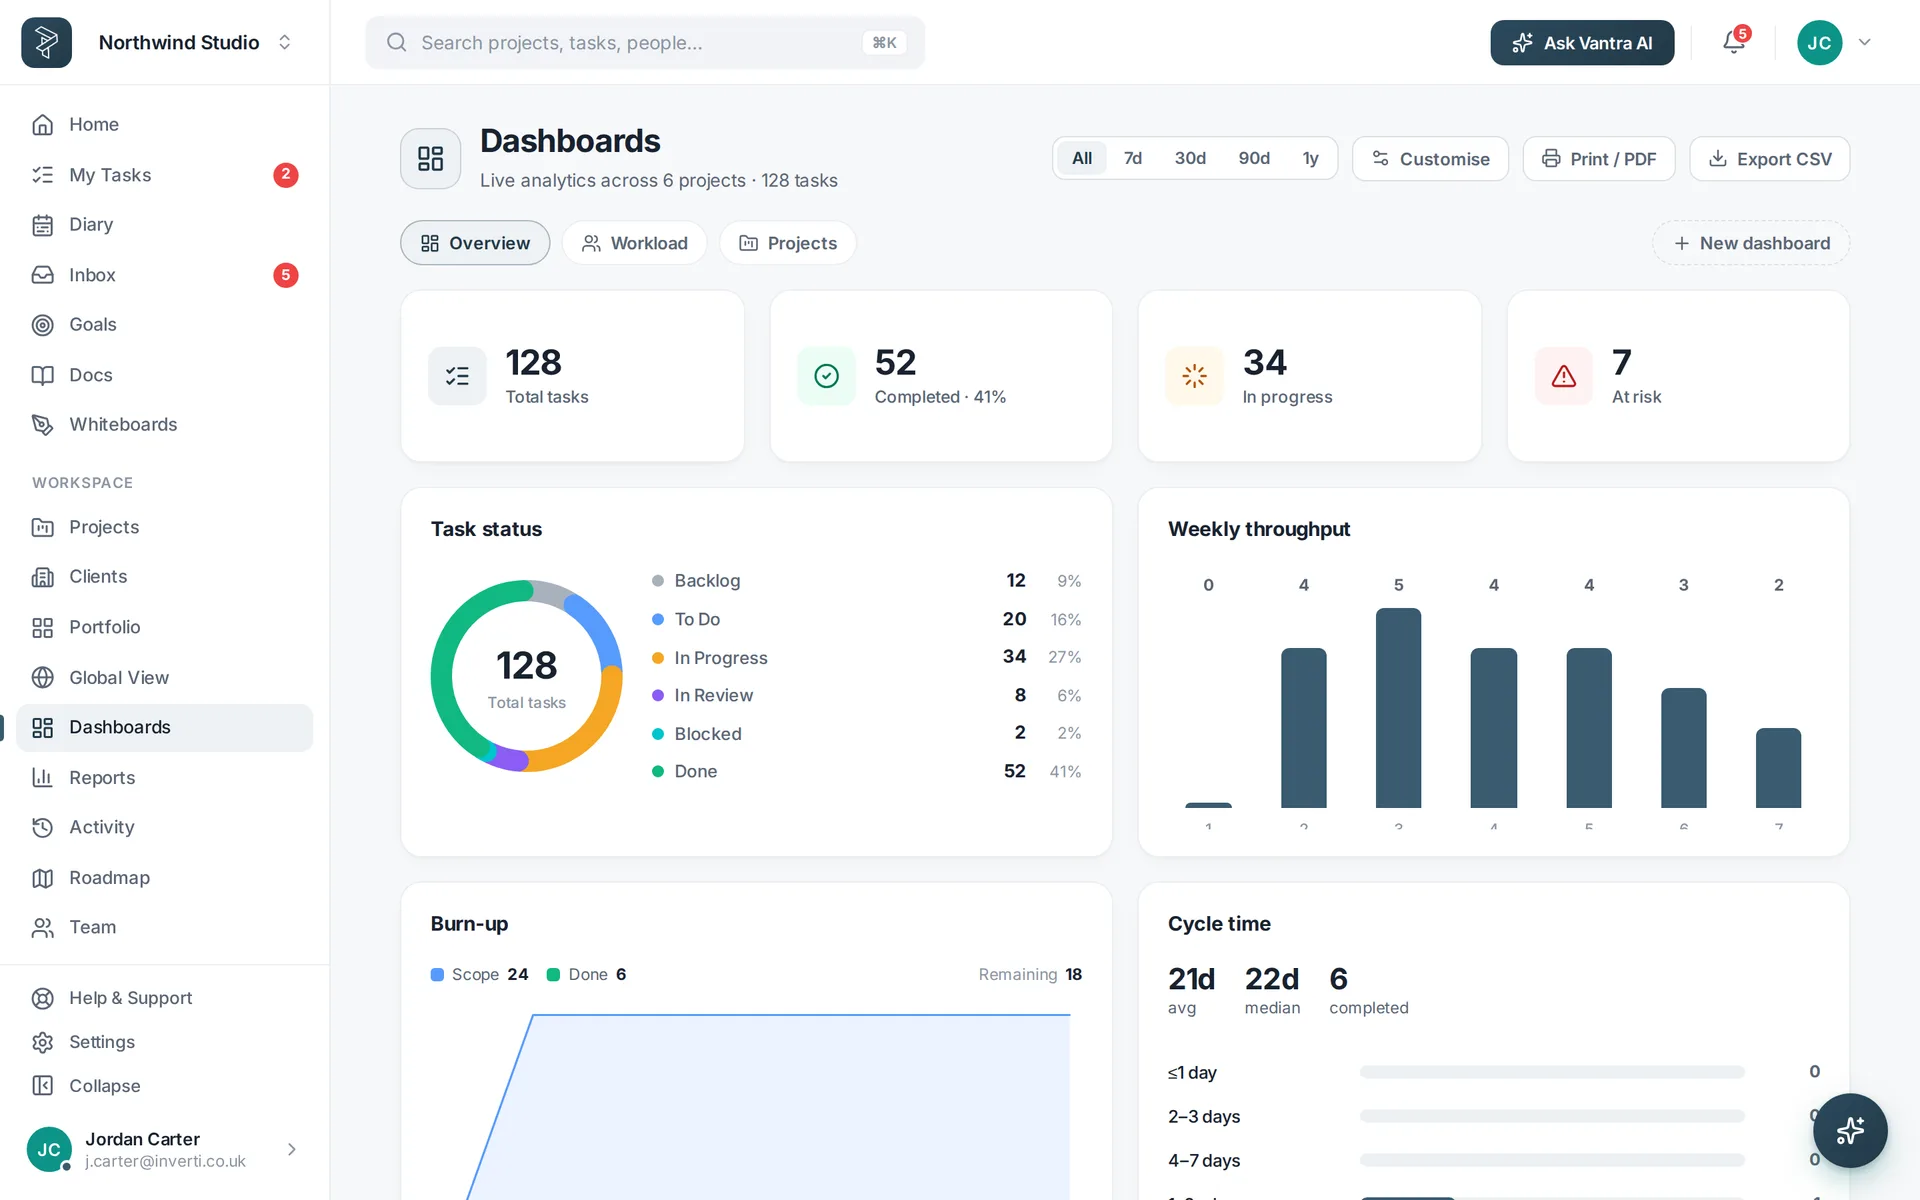
From Dashboards, create a board and pick from twenty-eight widgets — progress and completion trends, workload by person, overdue and at-risk lists, goal rollups, time logged and more. Point each at a project, a group of projects or the whole workspace.
3Make it the Monday ritual
Open it at the start of the week, walk the widgets top to bottom, and let the numbers drive the conversation. Export any list or report to CSV or PDF when someone outside the team needs the picture.
Related: Dashboards & reporting · Portfolio & workload — or try every step in the live demo →